At times, it can be hard to tell when to sell....
Even though at times it may seem difficult to spot a good buy point, it is even harder to spot a sell point. We get wrapped up in the moment when we see our all-star pick shining with a +20%! At this point in time, you are probably asking yourself, "do I sell and make out like a bandit?" or "do I hold on and get another +10% profit?". I will discuss this and also post up charts highlighting sell points and signals! I will also post a buy point special and highlight key buy points so that you can jump in a stock before its big run up! All this and more after I do my homework and labs, lol!
Ok, I'm done with some homework, so I decided to try and post some charts so that we can spot some tops and selling signs. One of the clearest signals pointing to you to sell a stock is industry sediment.
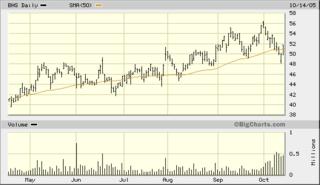
Yes, both of these charts are from two major homebuilder stocks. The top is Toll Brothers (TOL) and the bottom is NVR Inc (NVR). These 2 behemoths are industry leaders, and "speak" for the majority of the homebuilders. So basically, by noting and citing weakness in the big dogs, you can essentially figure that, that particular industry may have topped off. This is obviously the best time to take your profits and perhaps open up a short position. Now although industry weakness (the housing bubble in this case) is a great way to spot a top, it is not always the most reliable. Because of this, we have to also take a look at and explore other theories and clues (both technically and fundamentally) to spot tops and selling points. A perfect exception to the "follow the industry leaders" rule is that sometimes, companies that had been lagging during the leaders runup have just started their bullish uptrend. A perfect example is Brookfield Homes (BHS)
NVR Inc (NVR) 6 month chart
Brookfield Homes (BHS) 6 month chart
Here we can see that BHS is defying the notion of the industry sell off. Still, I do see BHS going down soon


0 Comments:
Post a Comment
Subscribe to Post Comments [Atom]
<< Home